Europe’s Inland Barges Need Cargo Demand to Guide Electric Fleet Plans
A 2050 corridor scenario points to a smaller barge fleet as fossil cargo declines, making durable customers and routes central to electrification plans.
Europe’s inland freight transition will depend on which cargoes still need moving over the lifetime of a vessel. A model of a large industrial port corridor points to a roughly 40% decline in bulk volumes by 2050, alongside a 42% drop in powered vessel-equivalents. That has direct consequences for owners weighing electric conversions, new vessels and charging infrastructure: the freight service needs to make sense before the propulsion investment does.
Recent data show why a single year can give a misleading picture of long-term demand. Coal throughput at Rotterdam rose 15.3% in the first nine months of 2026, and crude oil and petroleum product volumes also increased. The port attributed the coal rebound to recovering coking-coal movements, expensive natural gas and power market conditions. Yet across the EU, inland-waterway freight fell 3% in 2025, to 118 billion tonne-kilometres. Coal and crude petroleum freight increased that year, while agricultural freight contracted. Short-term gains in some cargoes sit within a broader market where both freight volumes and the mix of materials are changing.
The vessel fleet is already shifting. The Central Commission for the Navigation of the Rhine counted 6,224 dry-cargo vessels in Rhine countries in 2025, down from 6,410 in 2023, with smaller vessels accounting for much of the reduction. Tankers increased from 1,400 in 2022 to 1,477 in 2025. Those figures point to different pressures for different vessel types, as trade patterns and operating conditions change.
Fossil cargo drives much of the modeled decline
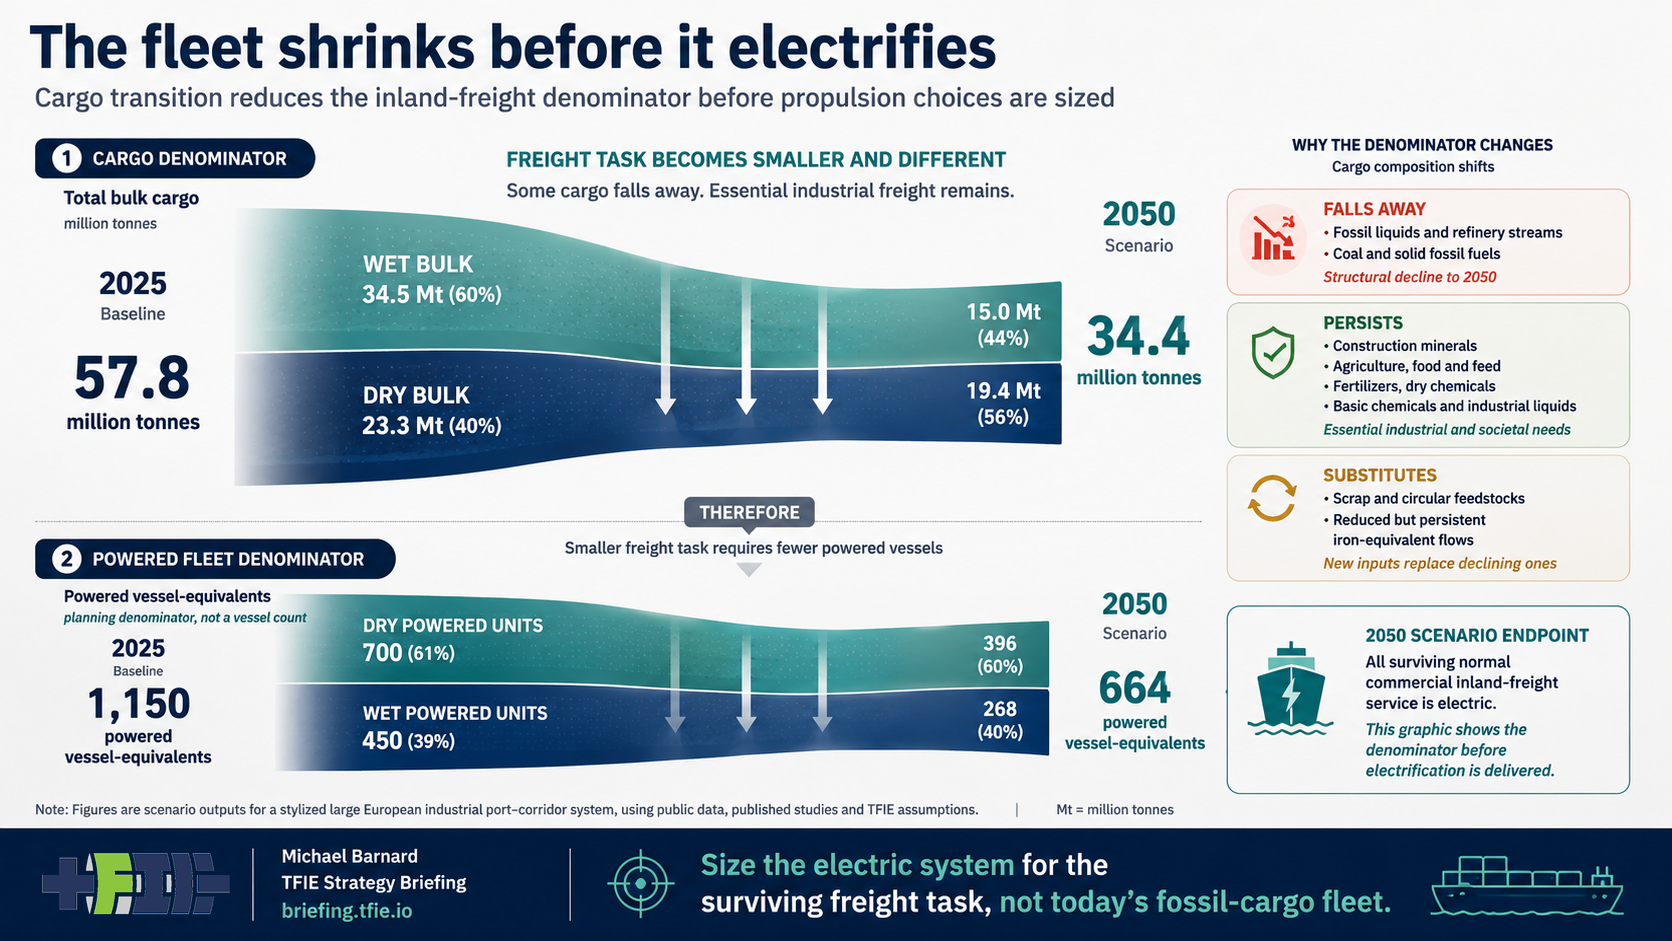
In the corridor scenario, bulk cargo falls from 57.8 million tonnes in the 2025-style baseline to 34.4 million tonnes in 2050. Wet bulk drops from 34.5 million to 15.0 million tonnes, while dry bulk declines from 23.3 million to 19.4 million tonnes. This is a scenario for investment planning across a type of European industrial corridor, not a precise forecast of Rotterdam’s future volumes.

Fossil-linked freight accounts for much of the modeled reduction. Fossil fuels and refinery streams decline from 19.0 million tonnes to 1.5 million tonnes. Coal and other solid fossil fuels fall from 2.5 million tonnes to zero. Together, those changes represent about 20 million tonnes of the corridor’s 23.4-million-tonne net decline. An operator built around coal or petroleum customers faces a different outlook from one serving grain, construction minerals, chemicals or scrap.
Other industrial cargo shows how the freight task may change rather than simply disappear. The scenario reduces imported iron ore and other virgin iron units from 4.5 million tonnes to 3.0 million tonnes, while scrap and circular feedstocks rise from 1.8 million to 3.5 million tonnes. Factories still need materials, but their inputs may come from different sources. Barges and terminals could find new work carrying those materials, although routes, loading arrangements and shipment sizes may shift too.
Biofuel feedstocks offer a separate test of investment timing. Their modeled movements peak near 5 million tonnes in 2030, then fall to 1.5 million tonnes by 2050. That temporary rise could support strong utilization for a time, but a thirty-year asset needs customers beyond the peak. The length and reliability of a cargo commitment matter alongside current volumes.

Tonnes carried do not equal vessels electrified
The model translates commodities into powered vessel-equivalents by accounting for parcel sizes, routes, loaded calls and productivity. On that basis, the corridor moves from about 1,150 powered vessel-equivalents to 664, a 42% reduction. Dry-cargo tonnage falls by 17%, but its powered vessel-equivalents fall by 43%, reflecting changes in the freight service as well as the amount of cargo.
The starting figure of 1,150 powered equivalents corresponds to about 1,234 physical hulls once unpowered barges moved by pushers are included. That distinction matters when estimating equipment costs. A pusher can propel several cargo barges, so converting one powered unit does not mean fitting propulsion to every hull in the formation. Counting all hulls as conversions would overstate the number of powered systems needed. Ports still need to consider the additional hulls when planning cargo handling.
Water depth adds another practical constraint. At low Rhine levels, a barge can remain in service but carry less cargo per journey because its draught is restricted. Shippers may need more trips, different hulls, or a shift of some freight to rail and road. Route depth, seasonal loading and terminal access therefore belong in an estimate of the service a vessel can reliably provide, alongside annual cargo demand.
Build the investment case around durable routes
Ports can start with a regularly updated record of cargoes, routes and material changes: what is declining, what persists and what is emerging. Vessel owners can connect that picture to hull age, yearly utilization, customer contracts and conversion costs. Terminal operators and utilities can then size grid connections, charging facilities and battery-container pools around vessels serving dependable routes.
Electric vessels already operate on container and bulk routes, and electrifying busy services can cut the emissions associated with inland freight. The practical opportunity is to match those systems to customers likely to keep using the routes over time. Europe’s barge transition will be shaped by both propulsion technology and the freight work available to support it. A clear cargo plan gives fleet owners and ports a firmer basis for deciding where electrification can last.
Sources: Rotterdam port throughput data, Eurostat inland freight data and the Central Commission for the Navigation of the Rhine fleet figures.